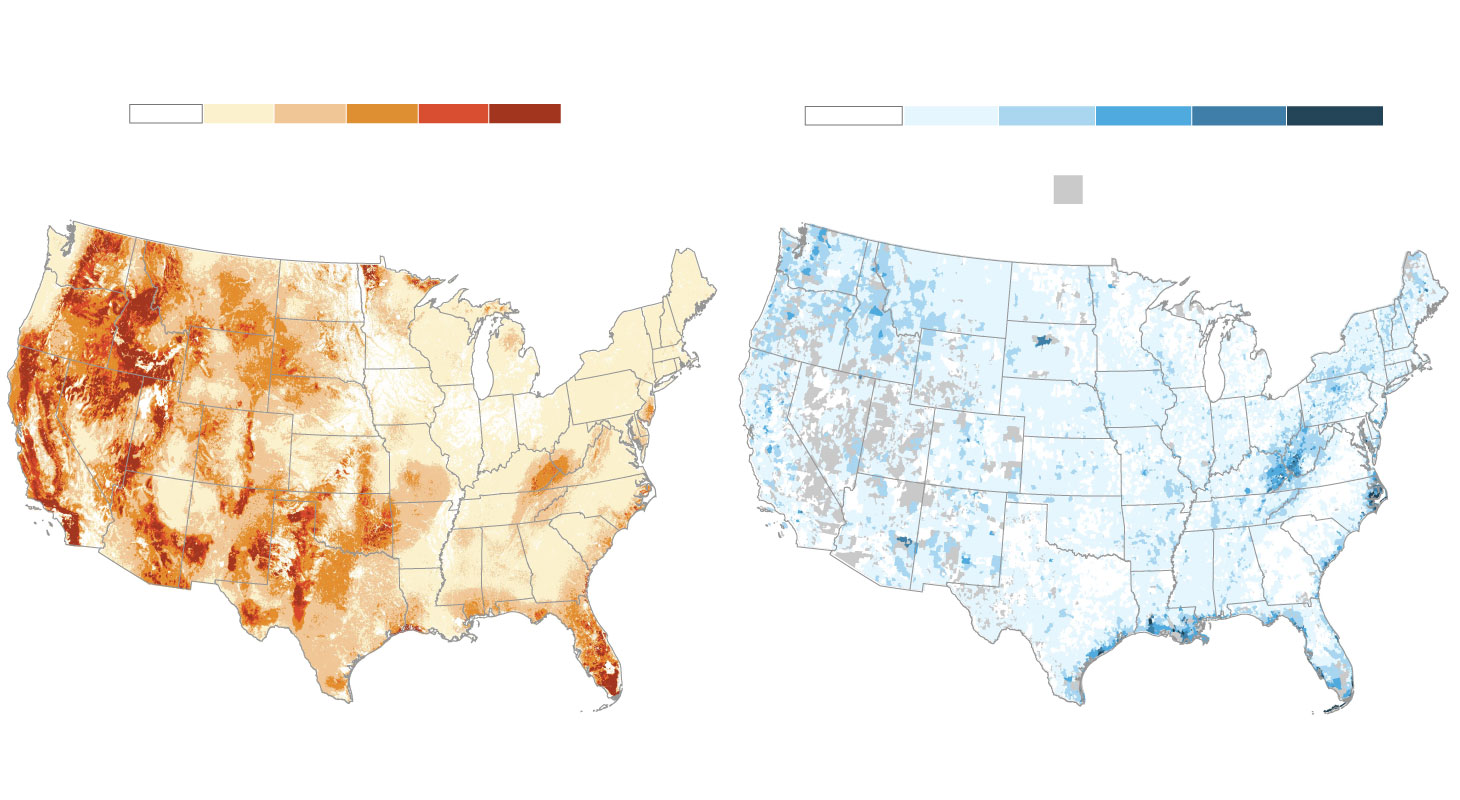
Wildfire Risk To Homes
Flood Risk To Properties
Percentile
Average Flood Risk
Minor
Severe
Extreme
Minimal
Moderate
Major
0
40th
70th
90th
95th
100th
= no data*
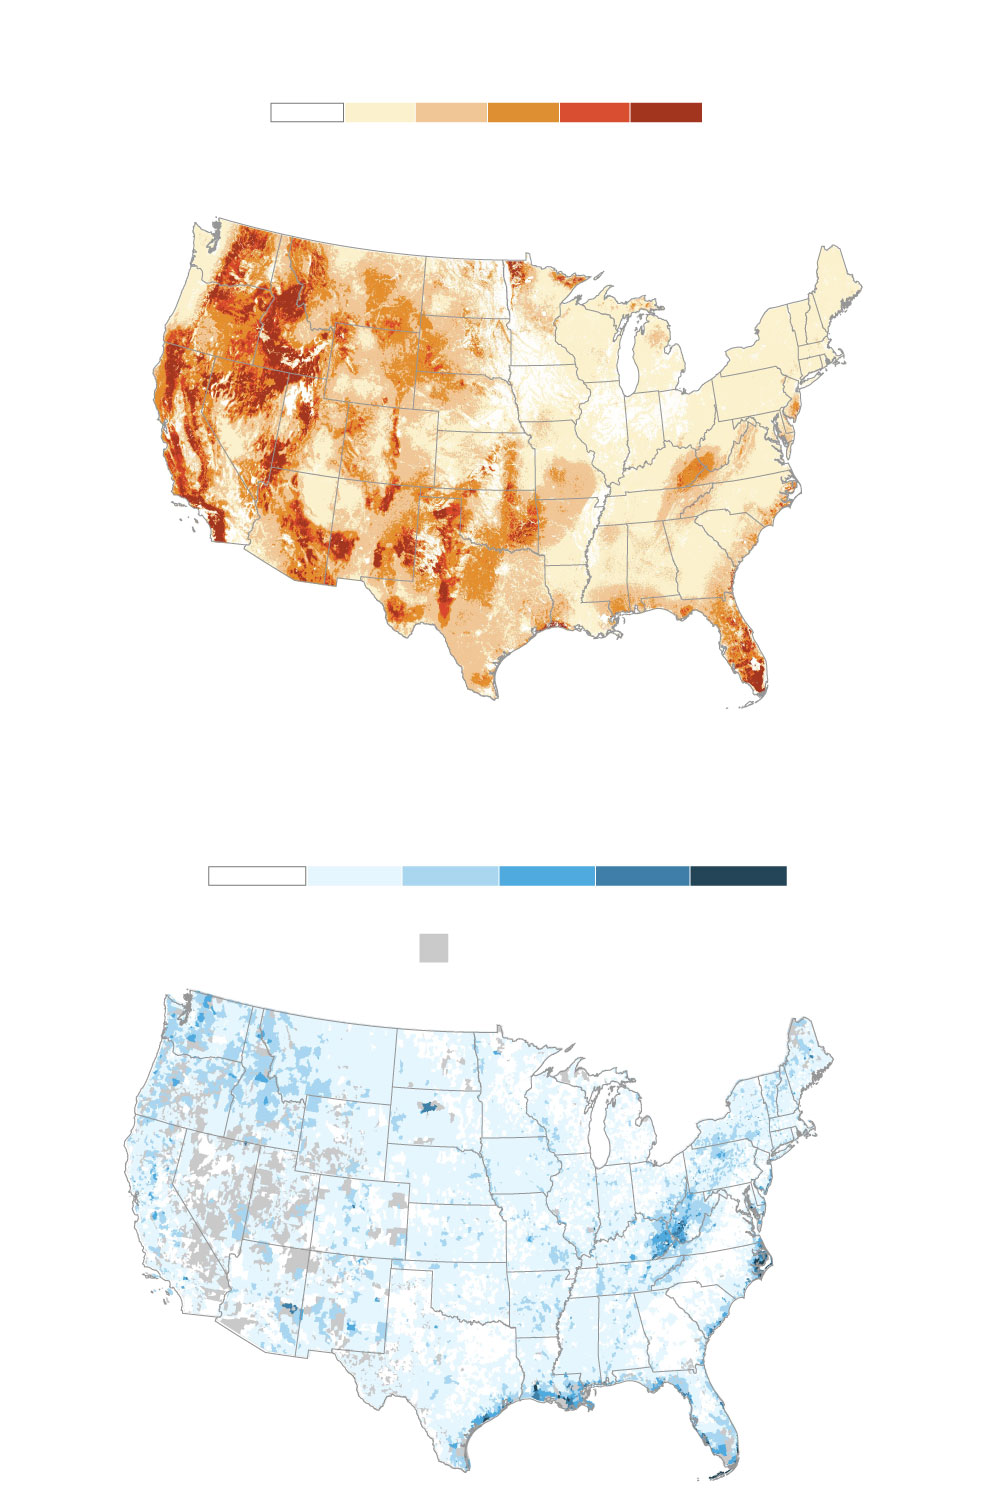
Wildfire Risk To Homes
Percentile
0
40th
70th
90th
95th
100th
Flood Risk To Properties
Average Flood Risk
Minor
Severe
Extreme
Minimal
Moderate
Major
= no data*
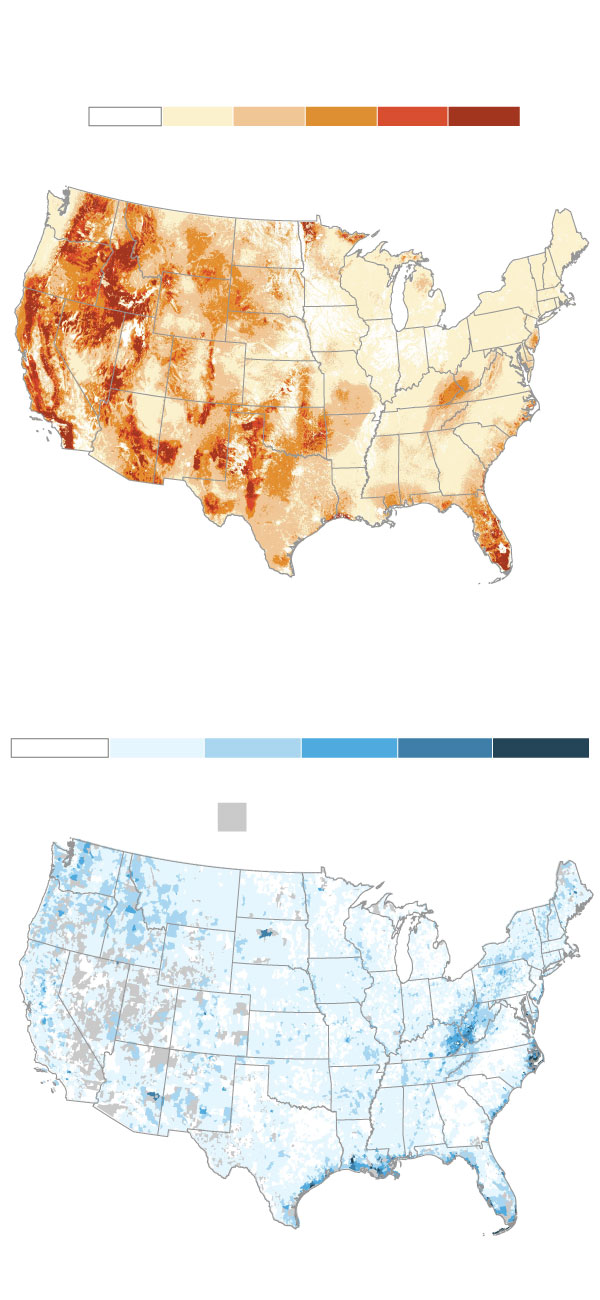
Wildfire Risk To Homes
Percentile
0
40th
70th
90th
95th
100th
Flood Risk To Properties
Average Flood Risk
Severe
Extreme
Minimal
Moderate
Major
Minor
= no data*
*This map displays flood risks across U.S. Census Bureau ZIP code tabulation areas (ZCTAs). Boundaries may vary from postal ZIP codes.
Wildfire risk incorporates the probability of a fire occurring; how intense that fire might be; and an estimate of how much a home may be damaged by such a fire. Flood risk is determined by a property's likelihood of flooding and the potential depth of that flooding. The fire map displays risk to both existing and future homes, while the flood map displays risk to existing properties, including both residential and commercial buildings.
Data only available for the contiguous U.S.