Vaccinations
| Vaccination Rate: TK% |
| 45 pts higher than the national average. |
| Death Rate: TK per 100,000 people since May 1 |
| 20x higher than the national average. |
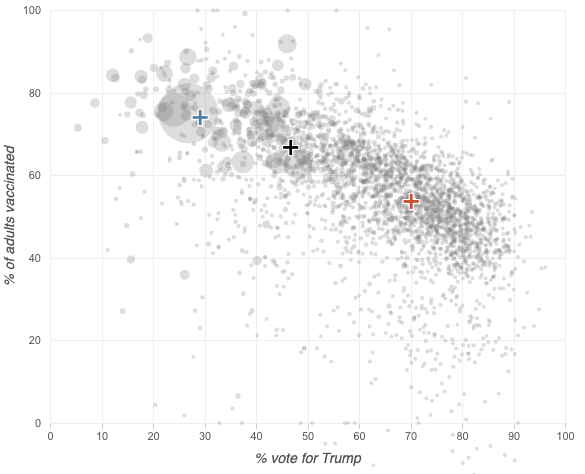
Circle sizes reflect population. Vaccination rates are percent of 18+ population vaccinated. Death rates are new COVID-related deaths since May 1. Averages are weighted by county population. The overall average represents the average of the 2,944 counties included in the analysis. "Heavily Trump" indicates a county that voted for Trump at 60% or more. "Heavily Biden" indicates a county that voted for Trump at 40% or less. Data is as of Nov. 30.